Inner Contents | |
| Benchmarking with Network/Kernel Layer | |
Benchmarking was performed using CME MDP emulator which transmits data previously recorded on channels 360 and 384 of real CME production environment.
Simulated environment makes pauses (Sending Delay) between two packets sent to determine the influence of network activity onto market data processing performance.
Benchmarking measures Market Data Processing Latency - the time used by C++ CME Market Data Handler to process market data starting with the moment when the Handler receives a packet from the network till the moment when the Handler passes the results of a packet processing to the users through correspondent callbacks.
Benchmarking results were obtained by the Benchmark sample supplied in a distribution package, and include latency for Messaging events, Direct Book Updates.
Benchmarking was done on a machine with Intel Core i7-7700K CPU running Ubuntu 17.04 Linux.
At the moment of benchmarking, 99% of messages, sent by MDP, contained a single atomic operation over the book for a particular instrument.
The following table summarizes characteristics of market data on the channels:
| Trait | 360 | 384 |
|---|---|---|
| Instruments on the channel | 4069 | 1905 |
| Average packet size in bytes | 429 | 178 |
| Average/maximal number of bids/offers in direct book | 10/10 | 7/10 |
The given major release introduced a redesigned messaging subsystem. Messaging the latency defines time since the moment of data reception till the moment when received data is validated by a processing session and passed to the users through the new OnixS::CME::ConflatedUDP::MarketDataListener callbacks.
| Sending Delay (ms) | Latency (μs) | |||||||||||
|---|---|---|---|---|---|---|---|---|---|---|---|---|
| 360 | 384 | |||||||||||
| Minimal | Median | Mean | 95% | 99% | Maximal | Minimal | Median | Mean | 95% | 99% | Maximal | |
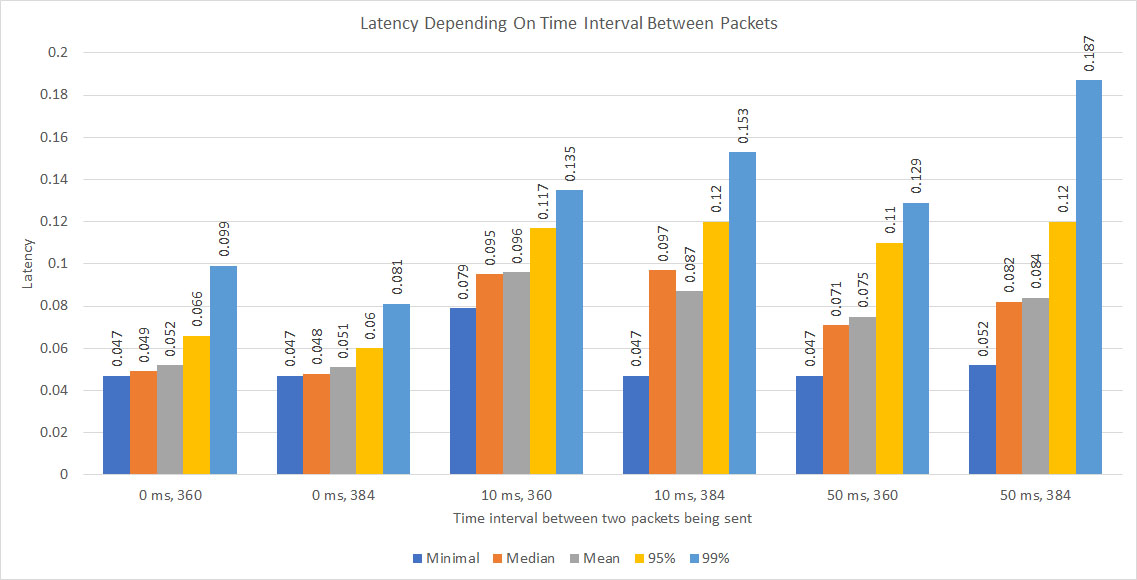
| 0 | 0.047 | 0.049 | 0.052 | 0.066 | 0.099 | 0.378 | 0.047 | 0.048 | 0.051 | 0.060 | 0.081 | 0.435 |
| 10 | 0.079 | 0.095 | 0.096 | 0.117 | 0.135 | 0.386 | 0.047 | 0.097 | 0.087 | 0.120 | 0.153 | 0.975 |
| 50 | 0.047 | 0.071 | 0.075 | 0.110 | 0.129 | 0.592 | 0.052 | 0.082 | 0.084 | 0.120 | 0.187 | 0.571 |
The visual presentation of latency depending on the interval between two transmitted packets depicted on the following chart:

Book maintenance latency represents the time spent by the Handler starting from the moment data is received till the moment when an updated order book is supplied through a correspondent callback. Depending on the type of book, different callbacks are invoked by the Handler.
Measurements for direct book updates are gathered into the following table:
| Sending Delay (ms) | Latency (μs) | |||||||||||
|---|---|---|---|---|---|---|---|---|---|---|---|---|
| 360 | 384 | |||||||||||
| Minimal | Median | Mean | 95% | 99% | Maximal | Minimal | Median | Mean | 95% | 99% | Maximal | |
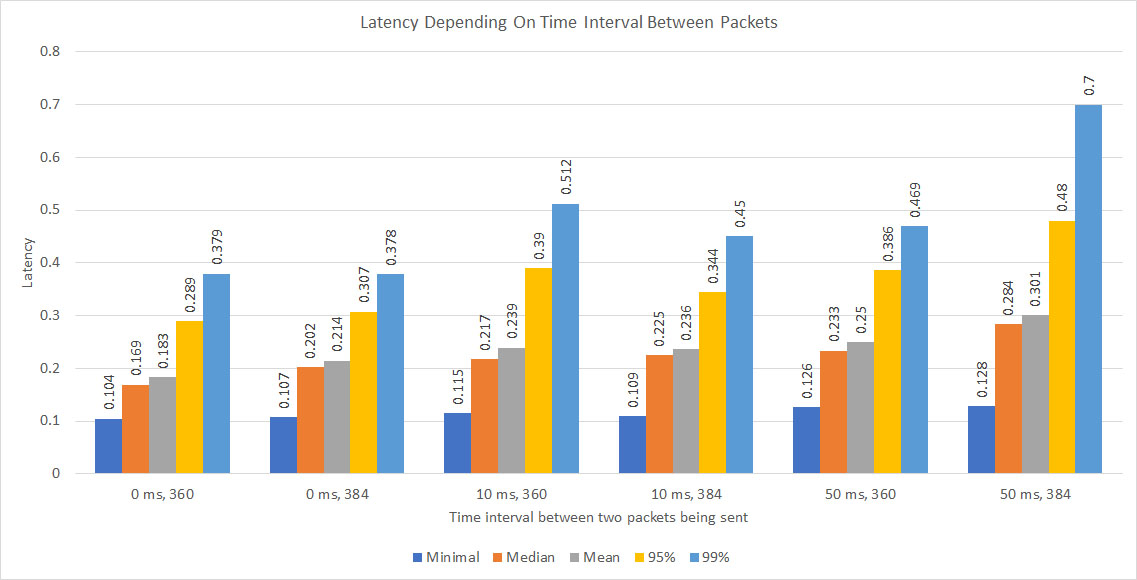
| 0 | 0.104 | 0.169 | 0.183 | 0.289 | 0.379 | 0.780 | 0.107 | 0.202 | 0.214 | 0.307 | 0.378 | 0.855 |
| 10 | 0.115 | 0.217 | 0.239 | 0.390 | 0.512 | 1.420 | 0.109 | 0.225 | 0.236 | 0.344 | 0.450 | 1.678 |
| 50 | 0.126 | 0.233 | 0.250 | 0.386 | 0.469 | 1.102 | 0.128 | 0.284 | 0.301 | 0.480 | 0.700 | 1.706 |
Following diagram depicts table values visually:

Minimal latency of a book maintenance machinery is almost 10 times less in comparison to the book maintenance latency measured for previous major release. Such performance boost is achieved by reducing processing time at session (messaging) level.
Also, in spite of both previous and latest major releases use almost the same book maintenance machinery, improvements implemented in latest release provide significant (up to 25 times) reduction of median latency compare to previous major releases due to switching using new memory management strategies and more effective data structures.